
So you have a sensor connected to your microcontroller. How do you calibrate it, particularly if the values from the sensor are not linear? That’s a problem I have thought about before and it came up again yesterday when I wanted a project to monitor a battery voltage level.
The current project that I am working on will be powered by a Li-ion battery charged from solar. This runs a microcontroller that monitors our driveway and mailbox. I want it to regular check the battery voltage to ensure that the battery is staying inside its recommended voltage range. I’m using an ESP32 in this project which has an ADC with an input that accepts 0 – 3.3v. In normal operation the battery voltage may go up to 4.2 volts. One method I have read about to deal with monitoring a voltage higher than the 3.3v limit of the ESP32 is to use a couple of resistors as a voltage divider. But that means there needs a formula to be convert the analog value to a suitable scale, in this case the actual voltages of the battery. Added to this conundrum is another possible issue that I came across mentioned in some posts that say the ESP32 ADC gives non-linear readings, including this github issue, Inconsistent values when using “analogRead()” #92.
Another project that I am interested in building is an anemometer. In this case I expect the rotating cups will trigger a reed switch or hall effect sensor as the cups rotate. That would require converting the time between these into wind speed. I want to build the sensor myself so there will not be a datasheet to find a conversion formula.
It’s a puzzle I’ve been thinking about for a while. These are some solutions I have found, at least for converting values for battery voltages:
- Try and work out a number to multiply the value by to get the required scale. eg. voltage = ADC_value * conversion_number
- Work out a formula based on values of the resistors e.g. VOUT= VIN (R2/(R1 + R1))
- Use a lookup table to map input values to output values
In one post a commenter linked to MyCurveFit. I had read about using MatLab or Excel to generate formulas that fit known sample values. I had never tried those, but MyCurveFit looked to be very useful and easy to use for this and importantly doesn’t require installation of software. As well as a paid service there are guest and free member subscriptions. The free services have limitations, but they may be good enough for many use cases. I used the guest access. If I understand correctly what I’m doing then this looks like an excellent resource.

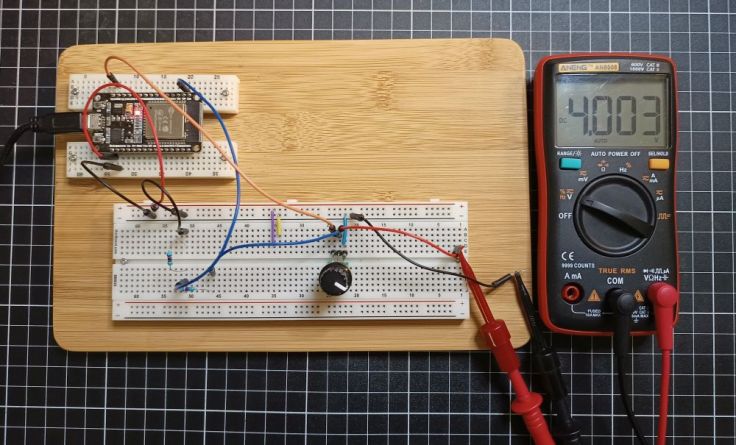
To test it out I set up an ESP32 with a voltage divider made up of 2 x 47K resistors leading into GPIO36 (Pin VP). I added a 10K pot connected between Vin (5ish volts from the USB) and GND and the middle pot pin going to the voltage divider. This allowed me to use the pot to send a voltage to the voltage divider of between 0 – 4.77v.
I uploaded this sketch to the ESP32. It displays and updates on the serial monitor the value on the analog pin every 1 second. Note the sketch includes the last value I tested voltage_value = (1.635301 * ADC_VALUE) + 294.5415;
/* Measure voltages with ESP32 */
// Potentiometer is connected to GPIO36 (Pin VP)
const int Analog_channel_pin= 36;
int ADC_VALUE = 0;
int voltage_value = 0;
void setup() {
Serial.begin(115200);
}
void loop() {
ADC_VALUE = analogRead(Analog_channel_pin);
voltage_value = (1.635301 * ADC_VALUE) + 294.5415;
Serial.print("ADC value = ");
Serial.print(ADC_VALUE);
Serial.print(" ");
Serial.print("Voltage = ");
Serial.print(voltage_value);
Serial.println(" mV");
delay(1000);
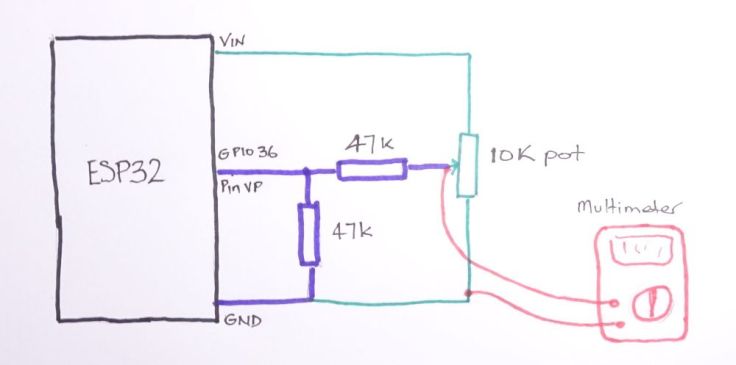
}A multimeter was connected between the middle pin on the pot and GND so that the multimeter was reading the voltage going into the top of the voltage divider. This is the schematic. Much simpler than the photo above suggests.
I made a series of measurements, and these are the values I got. All voltages as millivolts as that is what I want to end up with.
| ADC | Actual Voltage (mv) |
| 430 | 1003 |
| 1046 | 2004 |
| 1345 | 2496 |
| 1660 | 2998 |
| 1960 | 3496 |
| 2267 | 4003 |
| 2559 | 4776 |
| 2740 | 4776 |
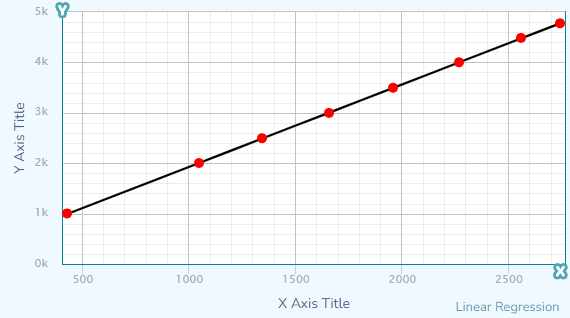
I opened up MyCurveFit and entered the values into data area at the bottom. In my case the ADC value for the X axis and actual voltages for the Y axis.

When I did this the points were plotted on the graph. Surprisingly it was fairly linear looking, but I chose two equal value resistors so that all highest reading that I expected would be below the top of the range of the 3.3v ADC where it is not as linear.
Next, I tried a couple of the fit methods. The first using a second order polynomial and the second using a linear straight line.
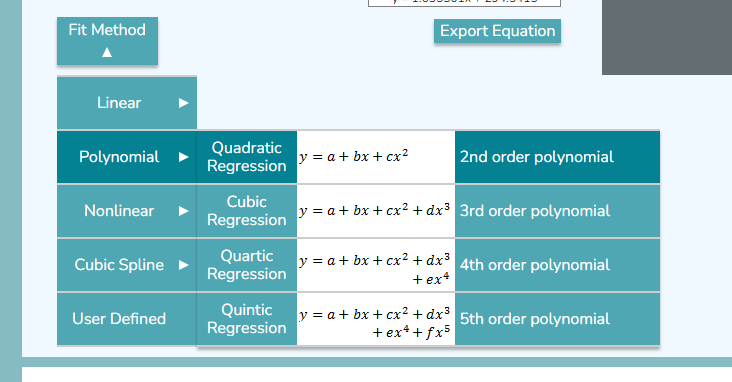
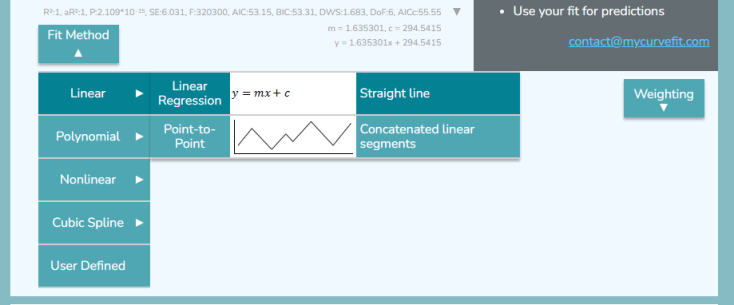
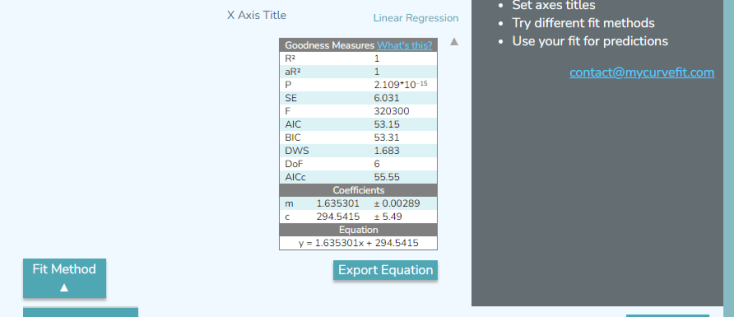
Once a fit method is selected clicking on the down arrow at the bottom left of the graph opens up a table with details. The bottom row has the suggested equation. The Export Equation button makes it easy to copy the equation.
To check the results I tried two things. One was to open up Excel and add the formula to cells and have Excel do calculations and the other to enter the formula into the sketch above and see how it goes.
Looking at the results in Excel
I made this table in Excel. Remember all voltage values are in millivolts.

The first two column contain the values from the ADC that I obtained from the sketch and the voltage read by the multimeter.
The data in the blue columns are my attempt to pick a number that looked might be good enough based on the data in Voltage/ADC column. In this case the number is 1.76. It may be good enough for values in the range of 3-4.5 volts, but it is not great.
Data in the grey columns is based on the 2nd order polynomial equation suggested by MyCurveFit y = 308.4076+1.613682x + 0.00000664449x^2. In this example column H has the equation it suggested. For example cell F2 has the formula =308.4076+(1.613682A2) + (0.00000664449(A2^2)) to calculate the value and cell G2 has a formula to calculate the difference from actual voltage =B2-F2
Data in the last two columns is based on the linear straight line equation suggested by MyCurveFit y = 1.635301x + 294.5415. In this example cell H2 has the formula =(1.6353018*A2)+294.5415) and cell I2 the difference from actual voltage =B2-H2
Both equations from MyCurveFit are very close to actual values. The linear one is a simpler equation and with the sample values is out by 11mV at most.
Using the equation in the sketch
Next was to add the equation into the sketch. I ended up going with the straight line equation because it was simple and gave near enough results. It is already in the sketch above to calculate the voltage value.
voltage_value = (1.635301 * ADC_VALUE) + 294.5415;The updated sketch was uploaded again and changed the pot to checked other values on the multimeter and compared those printing out on the serial monitor. All values all looked acceptable.
Some things to note
- I’ve been advised by two family members to beware of using the equation for values outside of the largest and smallest sample values used to generate it, as results beyond them can give wildly inaccurate results.
- The equations I used have a lot of decimal places, it probably is not necessary to go to so many places in practice. It would be easy to test predicted values by changing these in Excel.
- I went overboard with brackets in the formulas. I got the same results without them but it made it simpler for me to understand.
- Using a simple value to multiply the ADC value by would probably have been good enough, but what I’m really wanting to understand is how to do this for any sensor, particularly where it is not linear.
- Before you comment about it, I’m aware that I won’t be able to read low voltages as the ESP32 making the measurements is measuring its own battery and will shutdown long before the voltage gets really low.
Your feedback
So what do you think? Are you a wizard with this type of thing. Am I on the right track? Do you have other methods?
